Energy meters
Electrical measurement for voltage, current, power and energy where visibility matters most.
Real-time measurement, solar and inverter visibility, logging, dashboards, reports and alerts — for one site or many.

Energy monitoring turns raw electrical readings into decisions. BHS EnergySync solutions combine meters, loggers and dashboards so you can see consumption, generation and performance in one place.
From a single plant room to multi-site estates, the same idea applies: collect reliable data, show it clearly, and alert people when something needs attention.
Monitoring can cover grid feeders, solar output, inverter status and key loads — with reports that support daily operations and longer-term planning.
Designed around real sites, real devices and practical monitoring needs.
Electrical measurement for voltage, current, power and energy where visibility matters most.
Capture and store trends so you can review history, not only today’s snapshot.
Track generation alongside consumption for a complete energy picture.
Visibility into inverter behaviour, faults and performance patterns.
Clear day-to-day screens plus reports for managers and operators.
Notifications and remote views across locations from one connected platform.
A clear path from sensing and control to dashboards and alerts.
Choose feeders, loads, solar lines or inverters that need visibility.
Deploy meters, loggers and communication suited to the site.
Present KPIs, trends and status in web or mobile views.
Use thresholds and reports to reduce waste and respond faster.
Useful across homes, businesses, industries and multi-site projects.
Watch major loads and avoid blind spots in energy use.
Track bills drivers with clearer consumption insight.
Compare generation with expectations and catch dips early.
See many locations without travelling to each panel.
Pair the solution with BHS EnergySync products for measurement, control and connectivity.
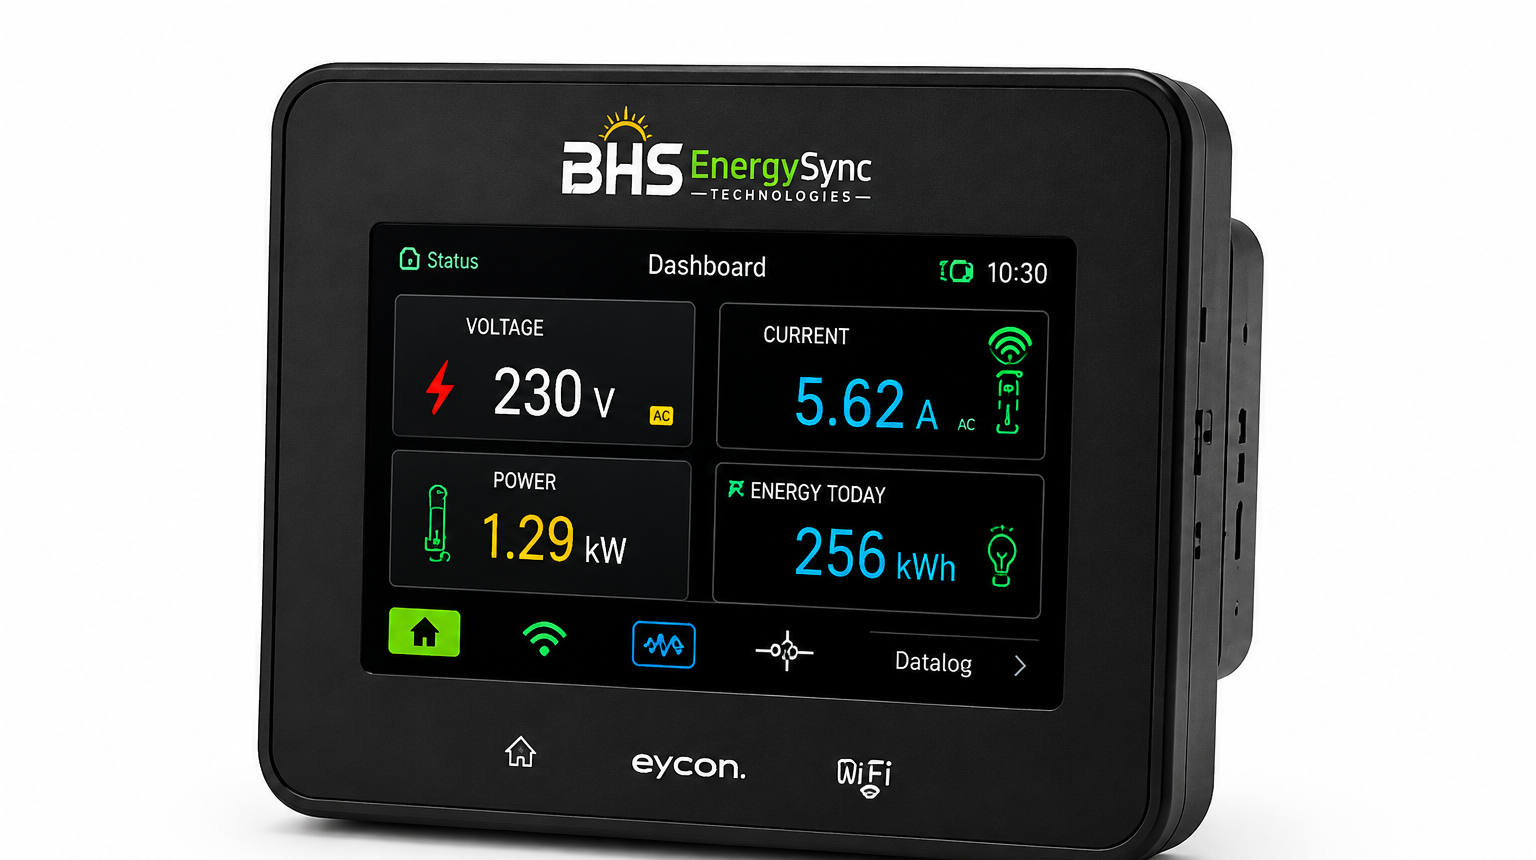
Core measurement device for live electrical readout.
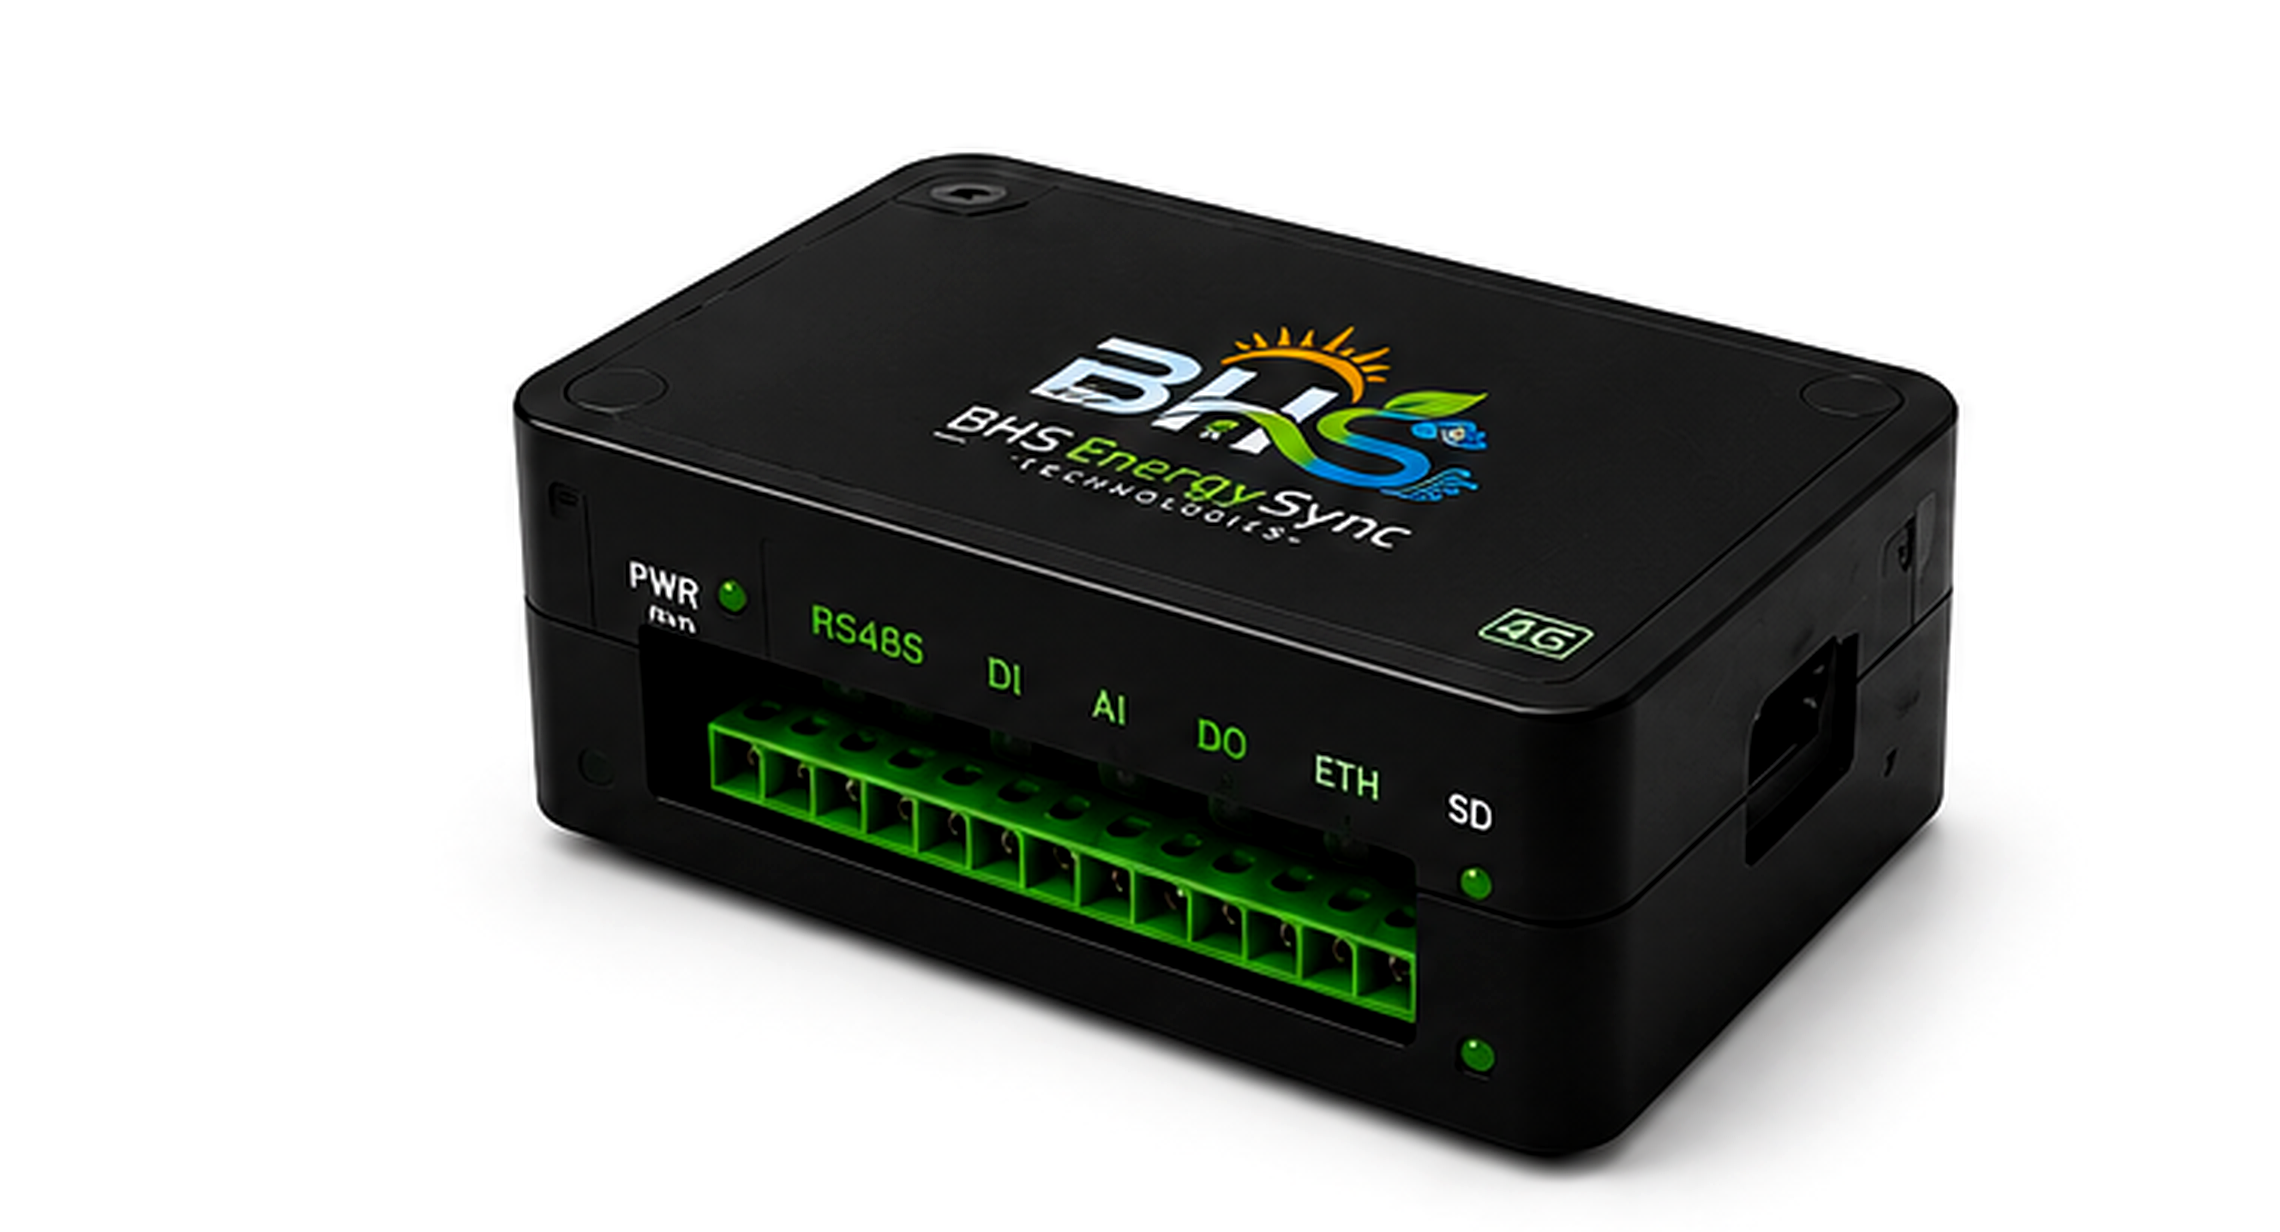
Industrial logging with RS485 and connectivity options.
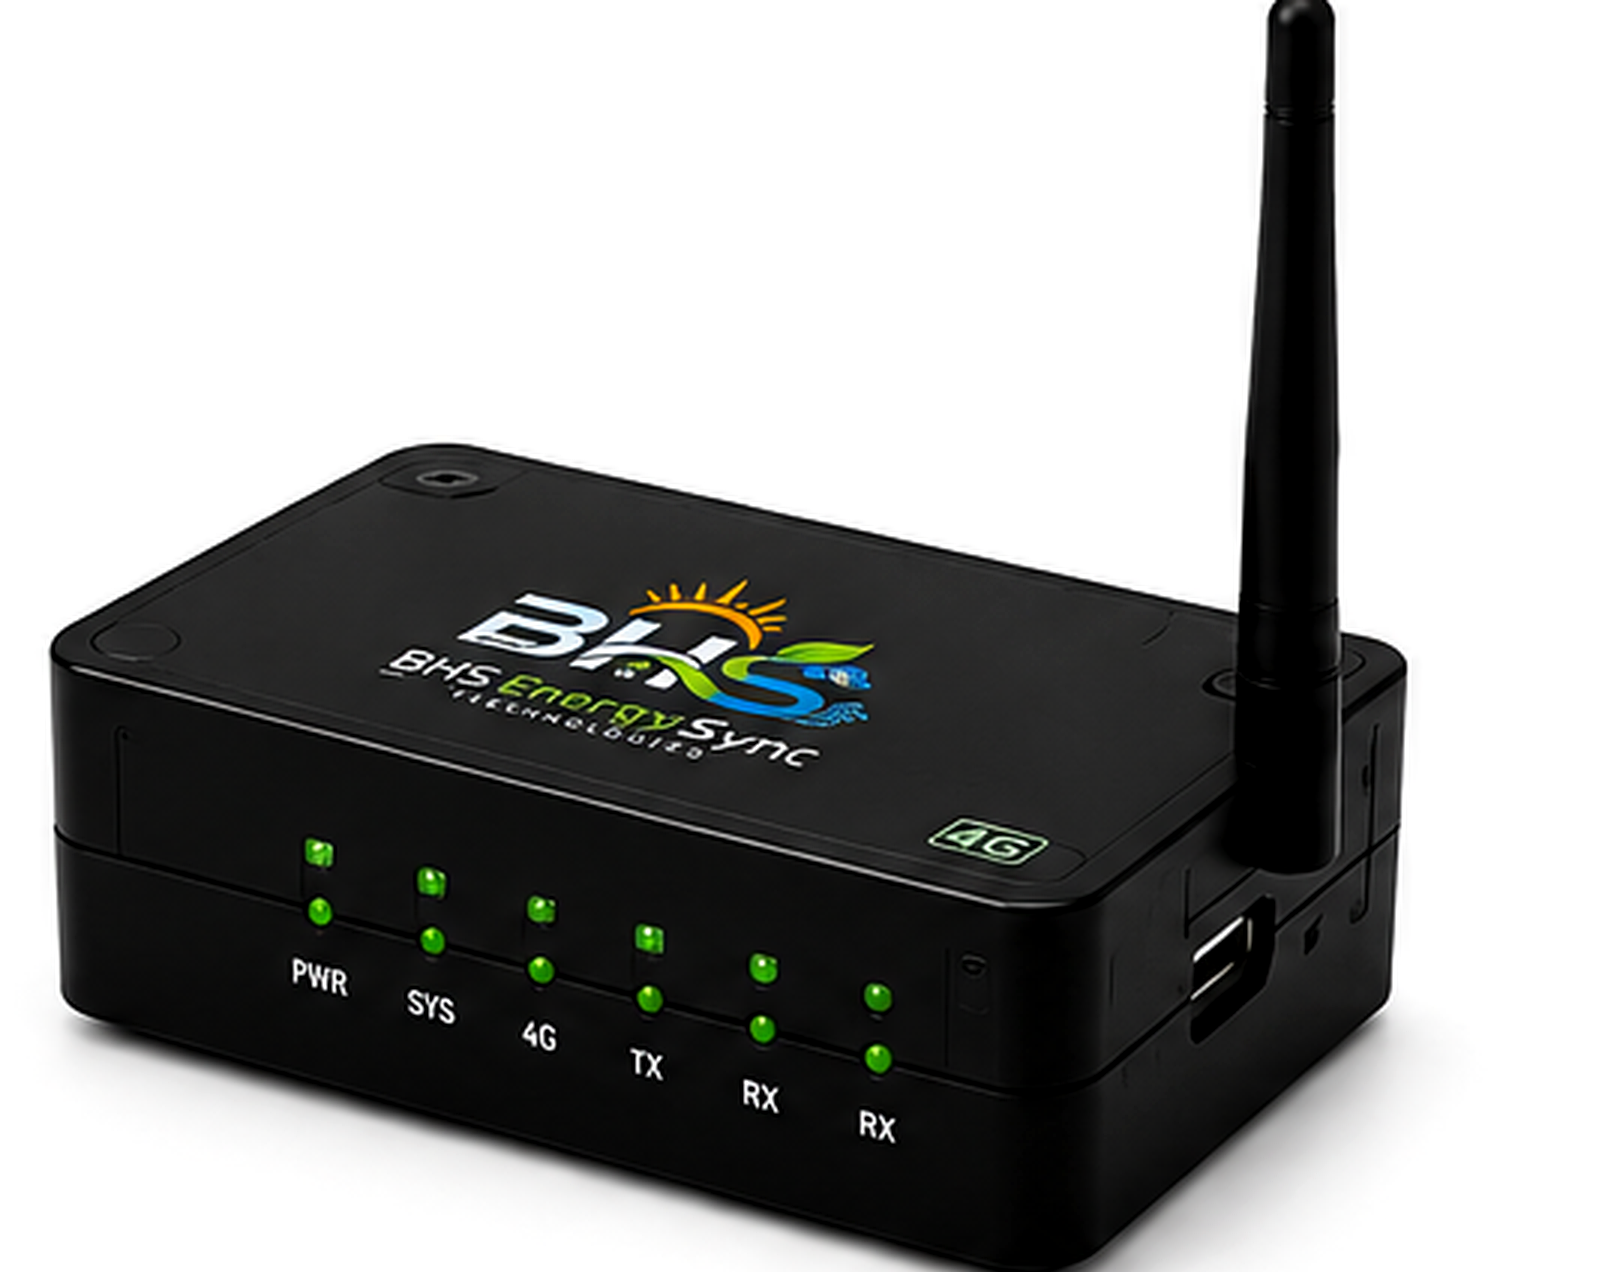
Bridge local meters to cloud monitoring securely.
Tell us about your site, devices and monitoring goals. We will help map hardware, connectivity and software.